Accessing Air Quality Data in OpenAQ Explorer
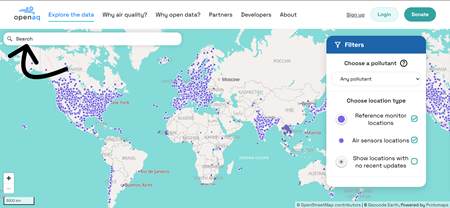
- Go to https://explore.openaq.org
- On the Search panel on the upper left side, type [location name] and choose the location from the dropdown menu.
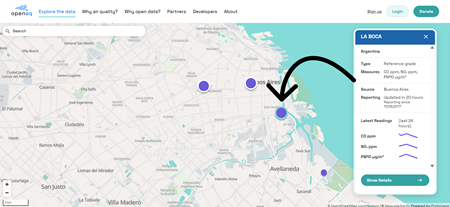
- If there is open air quality data at that location, you will see one or more purple dots. Click on a dot to see basic information about the air monitor or sensor on the righthand sidebar.
- Within the sidebar, click on “Show Details”, which will bring you to a page that includes Latest Readings and Patterns graphs.
- If you want to explore other monitoring locations elsewhere, go back to the map and pan out. Or start over (see #2), typing in a new location name.
- If you want to access data about a specific pollutant across many locations, choose a pollutant on the sidebar and click “Choose data providers.” This will take you to a list of data providers.
- Either “Select All” or choose one or more data providers by clicking “Select None” and then choosing the provider(s) you are interested in. The map will then show you locations where data on that pollutant is being collected by the provider(s) you selected.

Understanding the Instruments
Reference grade monitors are represented by larger dots with white circles around; they are the “gold standard” for measuring pollution concentrations and are typically operated by government agencies and used for regulatory purposes.

Air sensors are represented by smaller dots; they are less sophisticated instruments, but-- because of their small size, portability and affordability--are more easily deployed by institutions and individuals to fill in gaps in air quality knowledge.

Interpreting the Data
OpenAQ shares pollutant measurements as recorded by each instrument. These are “raw” data, in other words, not rolled into an Air Quality Index.
Air quality standards (the concentration level at which a pollutant is considered safe) are set by governments, and they vary across the world. The World Health Organization has set guidelines that are more protective than any county's standards. For example, the WHO's guideline for a safe level of fine particulate matter (PM ) over a 24-hour period is 15 µg/m (micrograms per cubic meter); whereas the strictest 24-hour national standard for PM2.5 is 25 µg/m .
The “Latest Readings” graph tells you how measurements have changed over time.
The “Patterns” graph tells you the diurnal (daily) trends for your chosen pollutant. Hover your cursor over a single vertical bar for a detailed statistical summary.
Additional OpenAQ Resources
To create lists of your favorite locations in OpenAQ Explorer, sign up for a user account. See the link under “Lists” on the opened sidebar, or register here: https://explore.openaq.org/register
To download larger volumes of data, use our API. See OpenAQ API Docs: https://docs.openaq.org
To understand Air Quality Indexes across the world, visit OpenAQ's AQI Hub: https://aqihub.info
Find out more about OpenAQ's mission, initiatives and impact on our homepage: https://openaq.org